The Koch Snowflake
A curve of infinite length enclosing a finite area — one segment becomes four, forever.
History
Helge von Koch introduced his curve in 1904 to give an explicit, purely geometric example of a continuous curve that is nowhere differentiable — answering critics who felt Weierstrass’s earlier analytic example was an unmotivated formula rather than a genuine “curve.”
Construction
Divide a segment into thirds. Replace the middle third with two sides of an equilateral triangle pointing outward. Repeat on every resulting segment, forever. One segment becomes , each scaled by :
If is the perimeter after steps from a unit triangle, — infinite length — yet the enclosed area converges to a finite limit.
The Koch curve is nowhere differentiable: at every point, the curve has no well-defined tangent, because at every scale it turns a corner.
PLAY → NOTICE → EXPLAIN
Infinite perimeter, finite area
For the Koch snowflake, every segment becomes four segments one-third as long. The perimeter therefore multiplies by 4/3 every round, while the added triangular areas get rapidly smaller.
Python implementation
Pseudocode first
koch(p, q, depth) {
    if (depth == 0) return {p,q}
    divide p--q into thirds; raise the middle third into a 60-degree peak
    return the four smaller Koch curves joined end to end
}
The executable version keeps the same shape; shared plotting/export details live in fractalfair_helpers.py.
from fractalfair_helpers import path_figure

def koch(p, q, depth):
    if depth == 0:
        return [p, q]
    step = (q-p)/3
    a, b = p+step, p+2*step
    peak = a + ROTATE_60 @ step
    return (koch(p,a,depth-1)[:-1]
            + koch(a,peak,depth-1)[:-1]
            + koch(peak,b,depth-1)[:-1]
            + koch(b,q,depth-1))
kochPoints :: Int -> P2 Double -> P2 Double -> [P2 Double]
kochPoints 0 p1 p2 = [p1, p2]
kochPoints depth p1 p2 =
  init (kochPoints (depth-1) p1 a)
    ++ init (kochPoints (depth-1) a peak)
    ++ init (kochPoints (depth-1) peak b)
    ++       kochPoints (depth-1) b p2
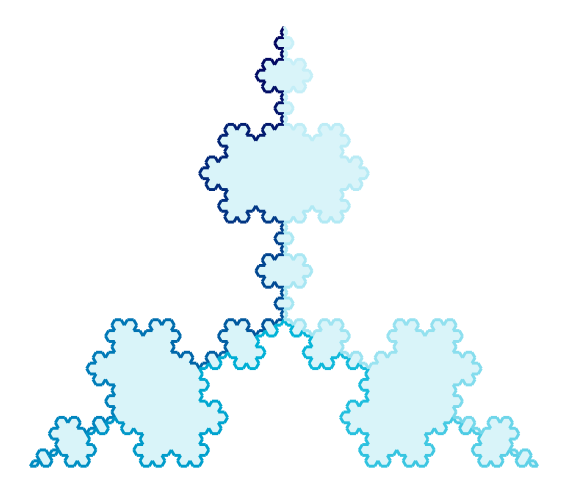
Figure: Depth 4 (three sides of 256 segments each), coloured along the traversal from deep blue to pale cyan.
Koch’s curve, the Cantor set, and Weierstrass’s function together formed what Poincaré dismissively called a “gallery of monsters.” Mandelbrot’s contribution, decades later, was arguing the monsters were better models of mountains and coastlines than any smooth curve.